FuelCell Energy Inc. (NASDAQ:FCEL) shares are trading higher Monday alongside other clean energy stocks, possibly after energy shortages are causing more demand for alternative energy. The stock also looks to have broken out a technical pattern.
FuelCell was up 15.90% at $8.57 at last check Monday at publication.
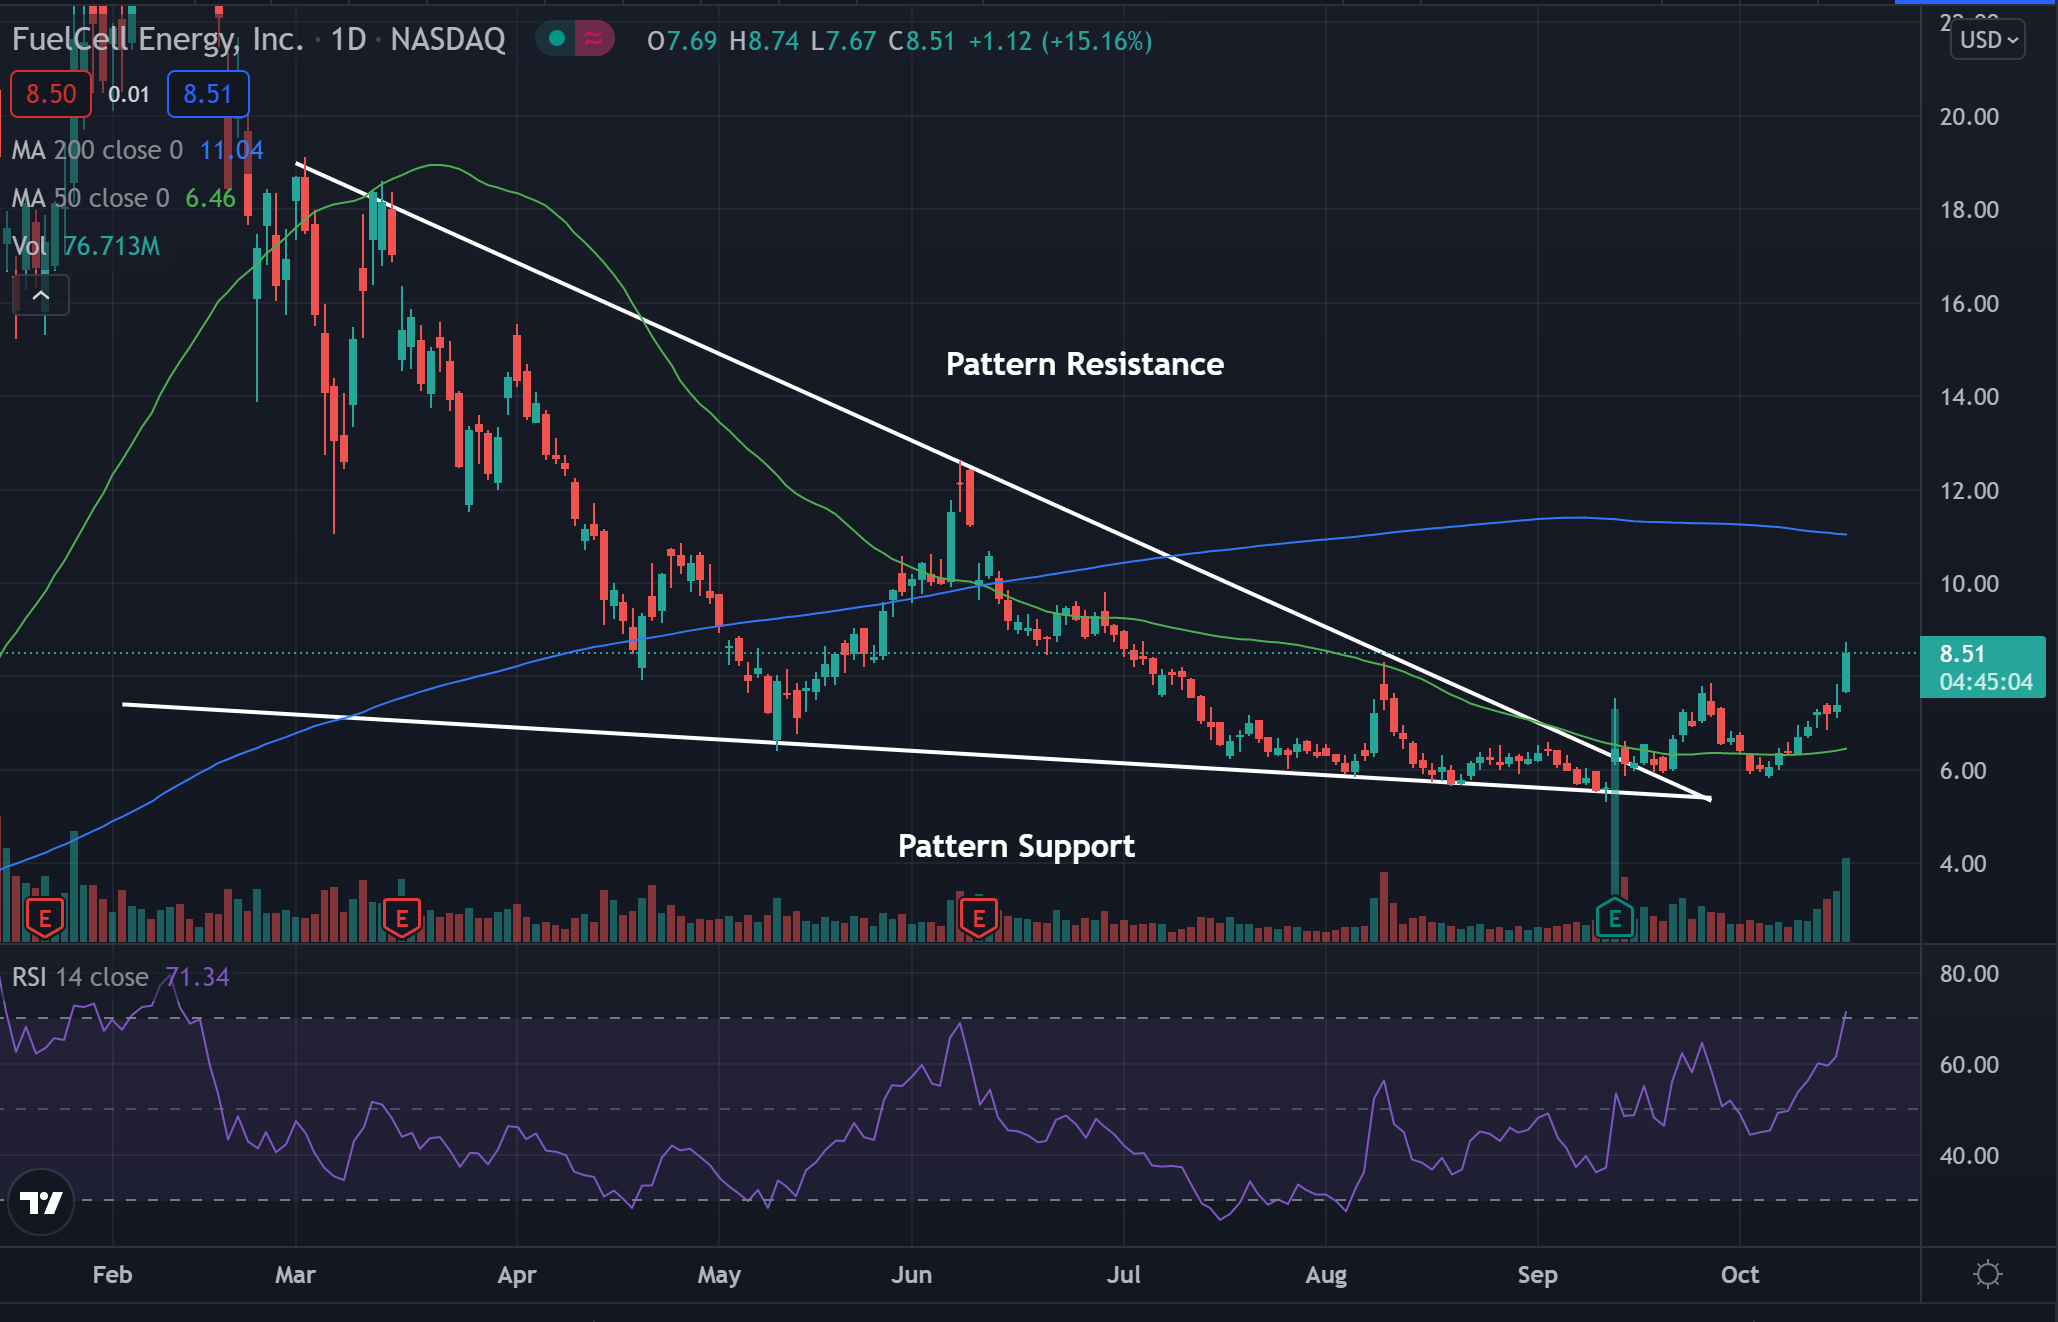
FuelCell Daily Chart Analysis
- The stock has broken out of what technical traders call a falling wedge pattern. The break of pattern resistance possibly started a reversal of the stock.
- The price was slowly falling and being condensed between narrowing highs and lows until the price was able to break above resistance. This caused a trend change and now the stock looks to have started forming higher lows.
- The stock trades above the 50-day moving average (green) but below the 200-day moving average (blue), indicating the stock is likely facing a period of consolidation.
- The 50-day moving average may hold as an area of support, while the 200-day moving average may act as a place of resistance.
- The Relative Strength Index (RSI) has been pushing higher the past few days and sits at 72. The RSI has moved into the overbought range now, signaling buying pressure is significantly outweighing selling pressure.
See Also: Why FuelCell Stock Could Be The Laggard Alternative Energy Play To Plug Power
What’s Next For FuelCell?
Bullish traders saw a breakout past the resistance of the pattern, possibly changing the long-term trend of the stock. Bulls want to see the stock continue to form higher lows to keep the trend going. Bulls would also like to see the stock cross above the 200-day moving average for sentiment to turn more bullish.
Bearish traders are hoping to see the stock dip back below the 50-day moving average and continue to fall lower. Bears are looking to see the stock push below where pattern support is for the stock to possibly start dropping once again.
Image by Myriams-Fotos from Pixabay